
Source: ASCE
By Benita Margaronis
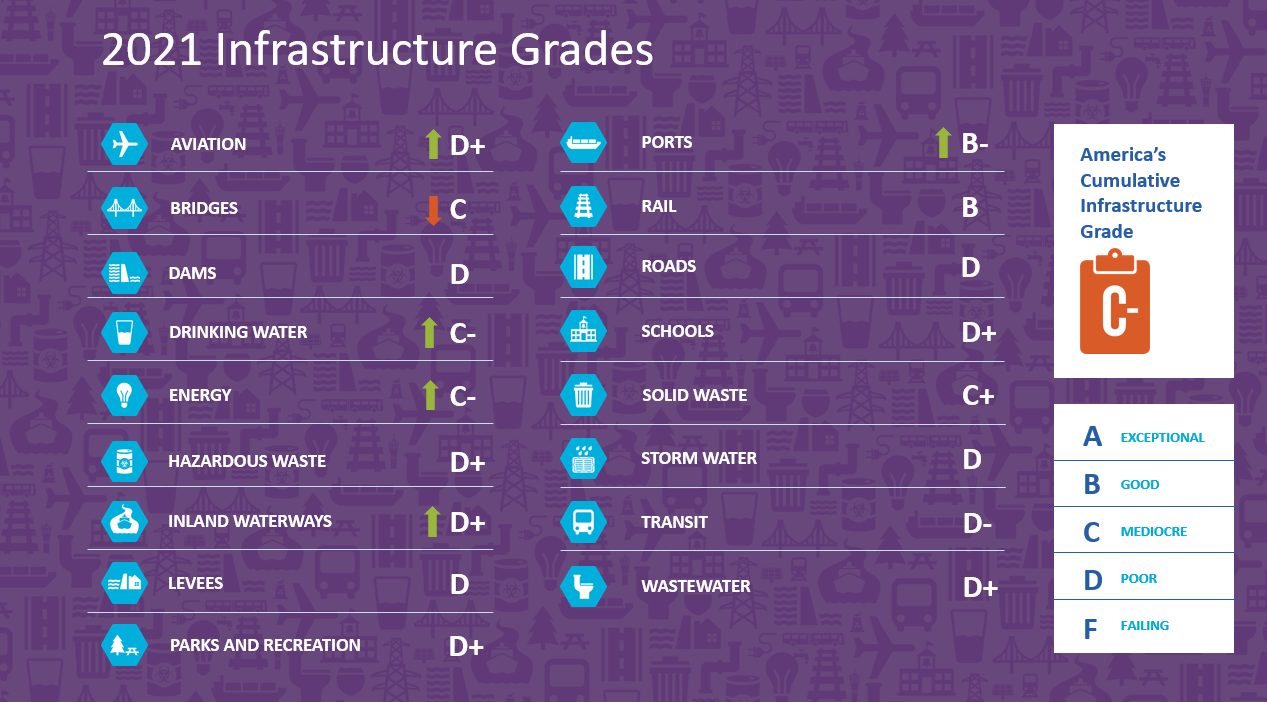
Think back to the days when you were in high school and college, what was the one thing that you feared seeing at the end of every semester? It was your report card! If your grades were good your parents would let you go to that super cool away summer camp and if they were lack luster you had to work in the garden all summer. Now this is an example of a small-time report card with no real consequences to the outside world, however, The American Society of Civil Engineers (ASCE) has a different report card of sorts. Every four years this group releases a report detailing the “grades” they’ve given to the nation’s infrastructure. They focus on 17 major categories. This report focuses on infrastructure conditions and the needs of that sector and it also gives recommendations on how to improve the grade it was given. They use an A to F grading format.
The first ASCE report card came out in 1998 and since then the nation has had a hard time getting out of the D’s and for the first time in 20 years the nation has finally became a C student. This is a huge step but there’s still a lot of work to be done.
The United States has over 4 million miles of public roadways and people live all over it so over time people have developed different ways of traversing this vast space. The main ways of travel are driving, public transit and flying. According to this report card, the aviation and road sectors have some of the worst grades at D’s, with public transit being the worst at a D-.
Roads are in a lot of trouble with over 40% of the roads in some state of disrepair. As the years pass more people are getting on the road with the vehicles getting heavier than they were when the roads under them were built. This deteriorates the roads at a much quicker rate then they should. Cargo is also a huge issue because cargo trucks are carrying more weight and they also travel longer and further then your personal car would. There is not enough money being put into protecting the roads.
The lack of attention to these 4 million miles of roads goes hand in hand with the transit sector with 45% of Americans having no access to transit. If the roads aren’t getting the attention they need then the way people are transported on these roads must also not be getting the necessary attention. The world around the transit sector is becoming more environmentally aware. This sector can’t keep up because they do not have the capital needed to get the necessary improvements that are needed. This also leads to the cuts inside the system with transit removing stops and different lines instead of adding stops and lines of travel. The 45 percentile of people without access to the necessary public transit is only bound to grow over the coming years.
The aviation sector in the last couple years also has a lot of gaps where the planes to people ratio is concerned. Passenger travel has risen from 964.7 million to 1.2 billion per year in the last couple years whereas, flight service has only increased from 9.7 to 10.2 million flights per year. There are not enough planes to carry the necessary passengers.
The United States has over 12,000 miles of navigable inland waterways, 30,000 miles of levees and 91,000 dams. These systems help and protect millions of Americans. One barge on the Mississippi river can move as many tons as 70 tractor-trailers. Inland water ways move over 830 million tons of cargo every year. This takes stress of the roads and bridges throughout the nation.
According to the Association of State Dam Safety Officials, they estimate the number of deficient high-hazard-potential dams now exceeds 2,300 out of the 91,000. This does not seem like a high number but only 80% of these have emergency action plans. A high hazard dam does not mean it’s going to fail but it means that if it does the impact around it will be catastrophic. On levees the report states that, “The nation’s levees are, on average, 50 years old, and many were built using engineering standards less rigorous than our current best practices.”
Public parks are very important because it gets tourists and Americans to see parts of the country that have been preserved and held onto to protect our lands and history. More and more people every year are going to see them. This puts stress on the infrastructure at these parks. It all requires money to maintain and keep staffed.
According to the report on the nation’s bridges, “There are more than 617,000 bridges across the United States. Currently, 42% of all bridges are at least 50 years old, and 46,154, or 7.5% of the nation’s bridges, are considered structurally deficient… 178 million trips are taken across these structurally deficient bridges every day.” For everything to get back into shape, funding would need to rise from $14.4 billion annually to $22.7 billion annually, or by 58%.
The United States has 2.2 million miles of underground pipes that brings water to our homes and businesses. The report states, “There is a water main break every two minutes and an estimated 6 billion gallons of treated water lost each day in the U.S.” When it comes to funding state and local governments have invested more than their federal counterparts have.
Solid waste is something that’s extremely important as The U.S. produced approximately 268 million tons of solid waste in 2017, or 4.51 pounds per person per day. If not disposed of properly there can be some bad consequences to the environment.
The nation’s more than 16,000 wastewater treatment plants are functioning, on average, at 81% of their design capacities, while 15% have reached or exceeded it. In 2019, though the annual water infrastructure capital investment gap was $81 billion
Annual spending on high voltage transmission lines grew from $15.6 billion in 2012 to $21.9 billion in 2017. Annual spending on distribution systems grew 54% over the past two decades. All three major components of the electric grid (generation, transmission, and distribution) have an investment gap. To meet the latest state-driven Renewable Portfolio Standards in generation infrastructure, the gap is projected to grow to a cumulative $197 billion by 2029.
Our nation’s rail network is divided into two categories: freight rail and passenger rail. Approximately 140,000 rail miles are operated by freight’s Class I, II, and III railroads. Amtrak operates over a 21,400-mile network, 70% of which is owned by other railroads, also known as host track. There is a current state of good repair backlog at $45.2 billion for passenger rail while freight rail has good backing.
The nation’s more than 300 coastal and inland ports are significant drivers of the U.S. economy, supporting 30.8 million jobs in 2018 and 26% of the total GDP. Ports and port tenants plan to spend $163 billion between 2021 and 2025, up by over $8 billion in the last four years. However, there is a funding gap of over $12 billion for waterside infrastructure such as dredging over the next 10 years, with additional billions needed for landside infrastructure
School facilities represent the second largest sector of public infrastructure spending, after highways, and yet there is no comprehensive national data source on K-12 public school infrastructure. What data is available indicates that 53% of public-school districts report the need to update or replace multiple building systems, including HVAC systems. More than one-third of public schools have portable buildings due to capacity constraints, with 45% of these portable buildings in poor or fair condition. The best estimates indicate a minimum of $38 billion annual funding gap for public school facilities across the country.